2.4 GHz carries the property. 5 GHz is a close-in band.
I took the atlas page's own 780‑point path‑loss grid and applied a phone‑realistic link budget in both directions. The result is lower than the page's laptop numbers at range, and it matches the physical limit you suspected: the phone's transmitter, not the access point, sets the edge of coverage.
2.4 GHz Use this
| At the mast | 210–300 Mbps |
| At 100 m | 95 Mbps |
| At 320 m | 30 Mbps |
| Parcel ≥10 Mbps | 88% |
| Parcel ≥30 Mbps | 77% |
| Furthest working point | 319 m |
Phone in hand. In a pocket: 44% and 120 m.
5 GHz Do not rely on it
| At 25–50 m | 70 Mbps |
| At 50–75 m | 0 (spots to 50) |
| Beyond 75 m | no link |
| Parcel ≥10 Mbps | 9% |
| 90% of points | within 50 m |
| Best lucky path | 112 m |
The band is a small island around the mast, not a disc over the parcel.
Container link Recheck
| Atlas laptop, 2.4 GHz | 300 Mbps |
| iPhone 11, 2.4 GHz | 134 Mbps |
| Atlas laptop, 5 GHz | 346 Mbps |
| iPhone 11, 5 GHz | 57 Mbps |
| Distance | 99.1 m |
| 5 GHz verdict | marginal, one‑way |
At 99 m the phone's uplink on 5 GHz is about 1.7 dB above the AP noise floor.
This is not the same question the atlas answered
The atlas page asks "what does a 2×2 laptop receive". That is a downlink question. A usable Wi‑Fi link needs the phone to transmit as well. The uplink is about 9 dB weaker, so the edge of coverage moves in. Everything below uses the same terrain, the same LiDAR canopy and the same 780 points. Only the client radio changes.
Two directions must close. The phone's direction closes first.
A Wi‑Fi frame needs an acknowledgement. If the AP reaches the phone but the phone cannot reach the AP, the link falls back to low rates, then drops. Power and antenna gain are not symmetric: the AP has 30 dBm and 8 dBi. The phone has a small antenna and a battery‑limited transmitter.
The link budget at the far end
| Item | Downlink | Uplink |
|---|---|---|
| Transmit | 30 dBm + 8 dBi | 20 dBm (2.4) 18 dBm (5) |
| EIRP | 38 dBm | 20 / 18 dBm |
| Receiver gain | 0 dBi (phone) | 8 dBi (AP) |
| Received power | 38 − PL | 28 − PL |
| Noise figure | 5 dB | 4 dB |
| Result | Uplink SNR is about 9 dB lower | |
Three penalties the laptop model does not carry
- The AP sits under the crown. The AP is at 14 m, inside a 22 m tree. The path loss at 100 m is about 30 dB above free space. This is the largest single loss on the site.
- The body blocks 6 dB. In your hand the 2.4 GHz parcel coverage is 88%. In a pocket it is 44%.
- The phone is smaller. A 0 dBi antenna against the laptop's 2 dBi costs 2 dB, on both paths.
The atlas model uses a 2×2 laptop at 1.5 m with a 2 dBi antenna and closes the downlink only. Its 300/672 Mbps figures are the ceiling for a laptop, not for a phone.
The iPhone 11 radio
2×2 MIMO, 802.11ax HE80, 1.2 Gbps PHY on 5 GHz, 573 Mbps PHY on 2.4 GHz at 40 MHz. A Wi‑Fi 5 AP gives the same 2×2 80 MHz geometry, so the numbers hold on the WAVLINK AP too. Apple does not publish the transmit power. I used 20 dBm EIRP at 2.4 GHz and 18 dBm at 5 GHz. A ±4 dB error moves the 5 GHz edge between 30 m and 90 m. The 2.4 GHz result is stable.
Where the phone works, and where it does not
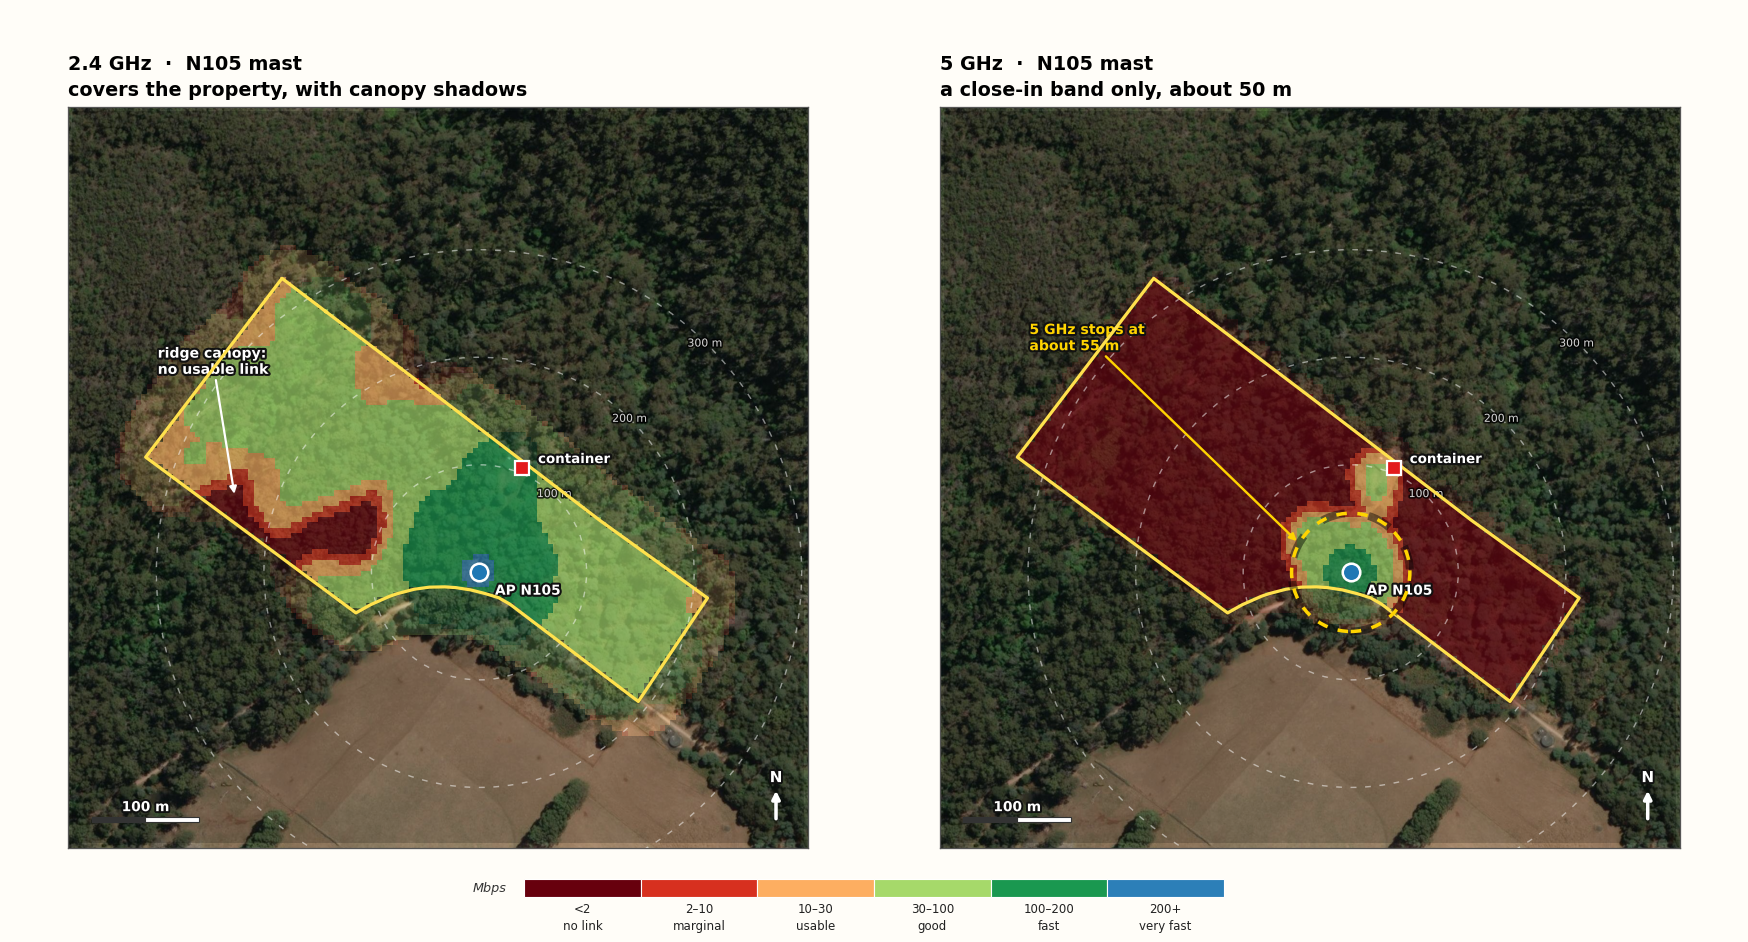
Predicted download speed for an iPhone 11 held in the hand at 1.5 m, from the mast AP at 14 m. Colour inside the yellow boundary comes from the 780‑point grid. Colour outside it is extrapolated with the same slope and is shown faded. This is a model, not a survey.
The west ridge shadow
A band 150–230 m west of the mast loses both bands. The canopy blocks the path, and the uplink drops below the AP noise floor. The atlas shows 30–50 Mbps here for a laptop. A phone gets nothing.
The 5 GHz island
5 GHz holds only within about 50 m of the mast. Two small lobes reach the container area. The rest of the parcel gets no 5 GHz link at all from this AP.
The far corner
The parcel is 329 m from the mast at the far corner. 2.4 GHz still gives 30 Mbps at 319 m. Beyond that the uplink stops. Expect a drop of about 10 m at the very tip.
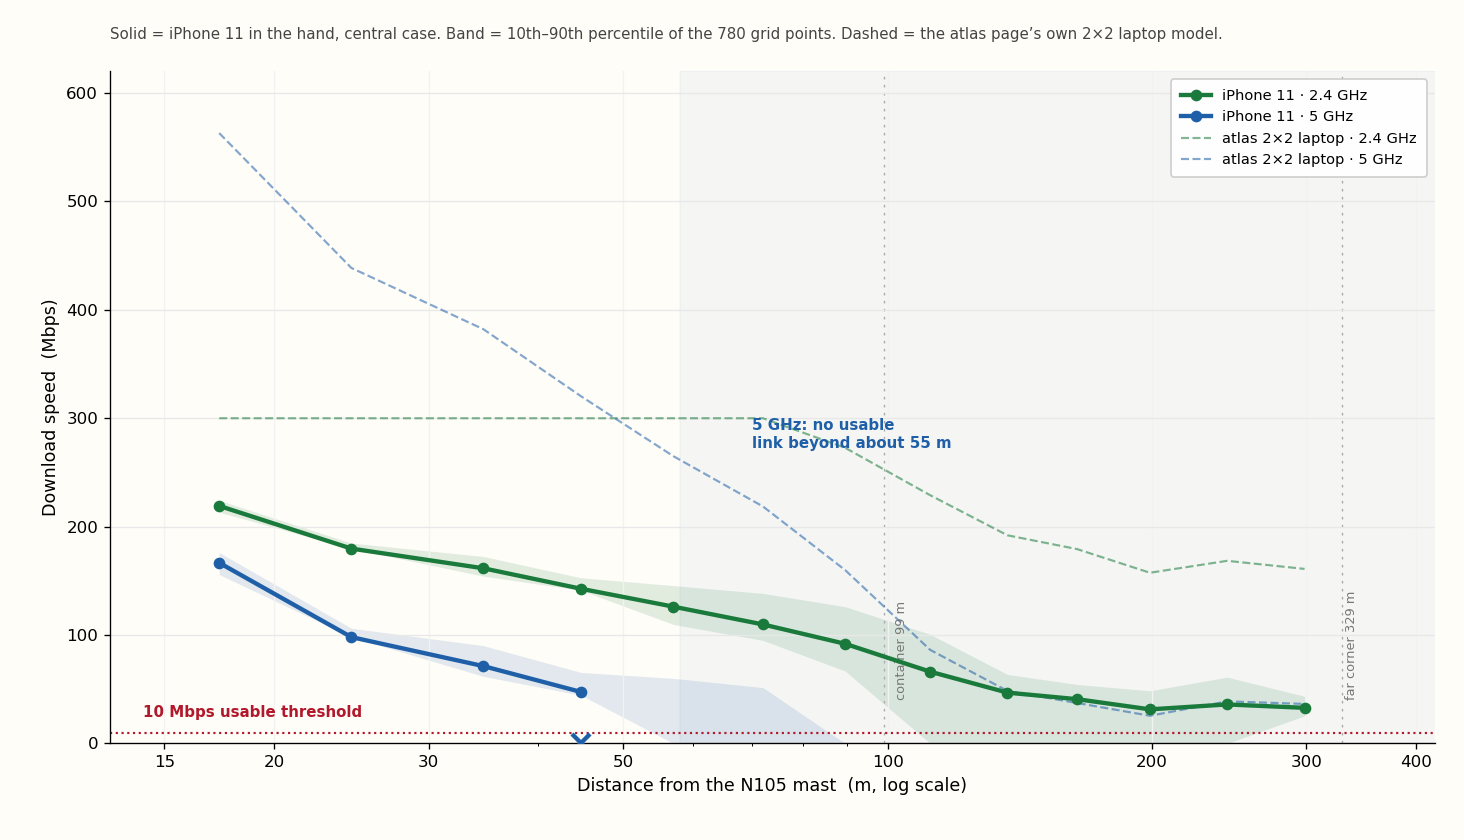
95 Mbps at 100 m on 2.4 GHz. Nothing at 75 m on 5 GHz.
Solid lines are the iPhone 11 in the hand. The shaded band is the 10th to 90th percentile of the grid, so it shows the spread from terrain and canopy at the same distance. Dashed lines are the atlas page's own 2×2 laptop model, for comparison.
| Distance from the mast | 2.4 GHz, phone in hand | 2.4 GHz, phone in pocket | 5 GHz, phone in hand |
|---|---|---|---|
| 0–25 m | 210 Mbps | 200 Mbps | 155 Mbps |
| 25–50 m | 160 Mbps | 120 Mbps | 70 Mbps |
| 50–75 m | 120 Mbps | 75 Mbps | 0 (spots to 50) |
| 75–100 m | 95 Mbps | 50 Mbps | no link |
| 100–150 m | 55 Mbps | 15 Mbps | no link |
| 150–200 m | 40 Mbps | 0–10 Mbps | no link |
| 200–320 m | 30–35 Mbps | 0 Mbps | no link |
Medians of the grid points in each distance band. The 100–150 m row hides the ridge shadow: some points there give 0 Mbps and some give 87 Mbps. Keep the phone in your hand. A pocket costs 6 dB and about half the property.
Three places where the phone gets nothing
1. West ridge shadow
150–230 m west of the mast, around the middle of the parcel's long axis.
Cause: canopy and ridge between the phone and the mast. Both bands fail. This is the largest dead area on the property.
2. All of 5 GHz past 75 m
91% of the parcel has no usable 5 GHz link from this mast.
Cause: the uplink at 80 MHz. Dropping to 20 MHz may keep the phone associated, but at 10–20 Mbps.
3. The far west tip
Past 319 m the 2.4 GHz uplink also stops.
Cause: distance plus canopy. The last 10 m of the parcel has no link. Walk back towards the mast to recover it.
What you will actually notice
Voice and messaging over Wi‑Fi call need about 100 kbps each way. The phone will hold a call over most of the property on 2.4 GHz, and through the shadow only if the call drops to a low rate. Video needs 5–25 Mbps. Expect clean video on 2.4 GHz out to about 250 m, and none in the shadow. Large transfers are fastest within 50 m of the mast.
Move the AP above the crown, and use 2.4 GHz for phones
The AP is 1 m below the top of a 22 m tree. That single decision costs about 30 dB of path loss and is the reason 5 GHz stops at 50 m. These changes are ordered by effect.
Design changes, in order
- Get the AP above the canopy. Highest gain. A 15 m mast cannot do it at N105 (22 m trees). A 25 m mast, or an AP on a pole above the crown, gives 2–3× more 5 GHz range.
- Put 2.4 and 5 GHz on separate SSIDs. iOS gives you no band lock. Separate SSIDs do.
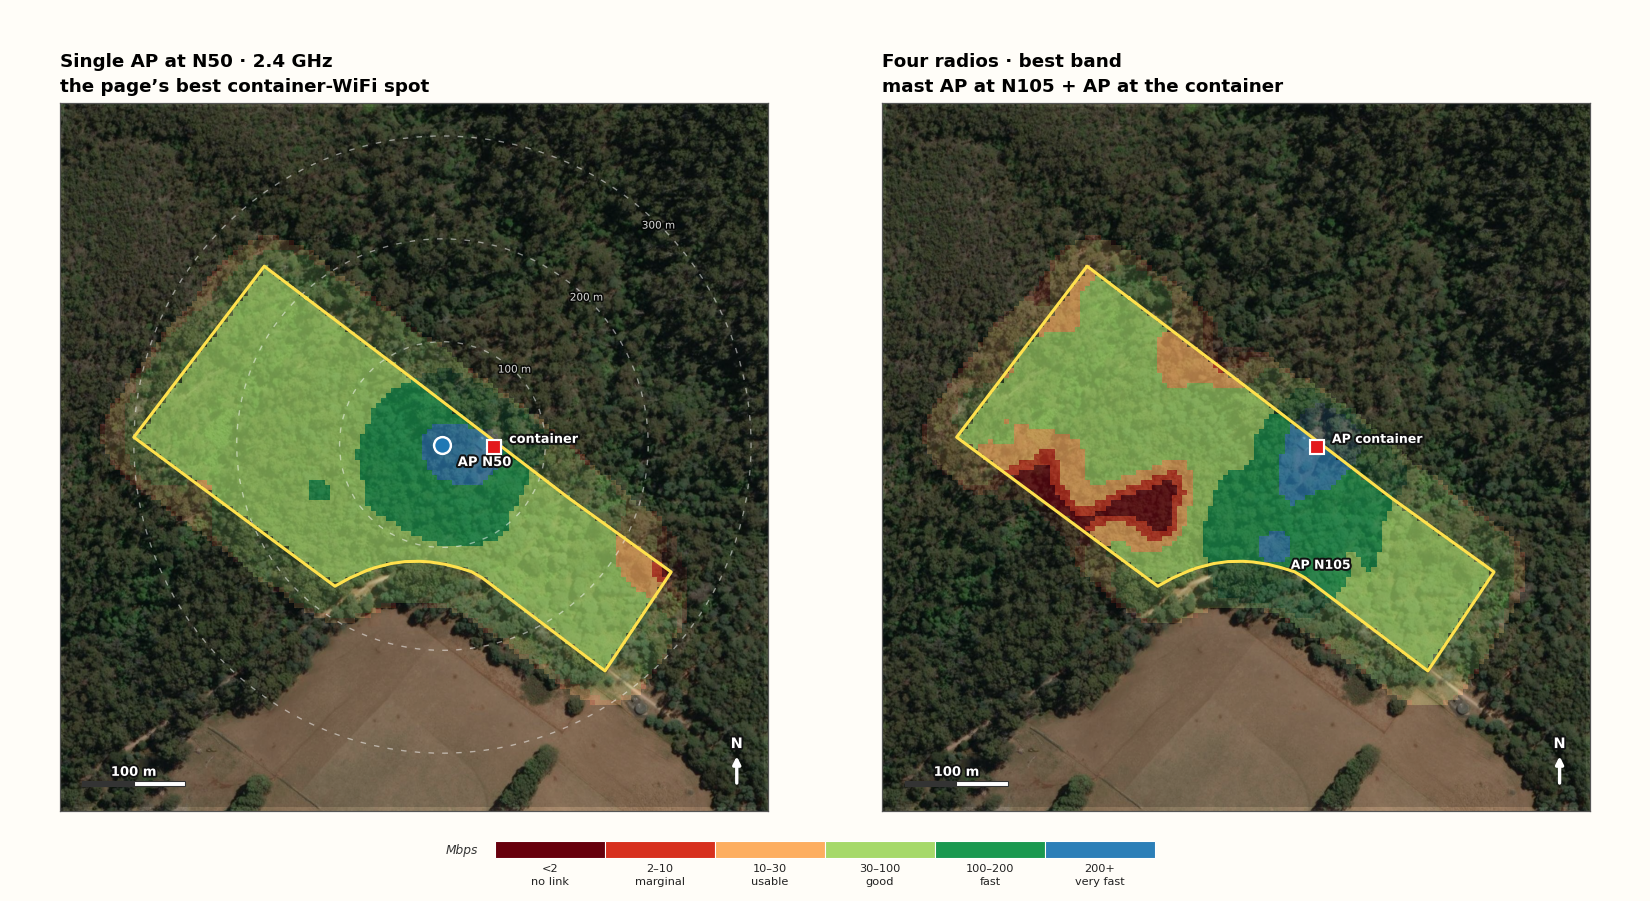
- Prefer N50 for walking. 99.5% of the parcel at ≥10 Mbps against 88% at N105. N50 is worse for cellular (44/14 Mbps).
- Add an AP at the container. The east half then gets 5 GHz again. Best overall build.
- Check the EIRP. 30 dBm + 8 dBi = 38 dBm EIRP. The Australian limit is 36 dBm EIRP at 2.4 GHz and at 5.725–5.85 GHz. Set the AP to 28 dBm. This costs about one fifth of the range.
What not to do
- Do not plan on 5 GHz from the mast. At the container it gives a phone about 57 Mbps, not 346. At 150 m it gives nothing.
- Do not put the AP at 14 m in the crown and expect the atlas numbers. The atlas figure is a laptop downlink.
- Do not use a pocket test as the design case. It halves the coverage and it does not match normal use.
- Do not sign a plan on this model. Walk the property first. The spread between the optimistic and pessimistic phone is a factor of three on 5 GHz.
The four‑radio option on the right is the practical target: 2.4 GHz everywhere, 5 GHz near either AP.
One afternoon with the phone proves or kills these numbers
Procedure
- Put 2.4 and 5 GHz on separate SSIDs on the WAVLINK AP.
- Raise the AP to its final height. Do not test at 14 m if you plan 25 m.
- Walk out from the mast at 25, 50, 75, 100, 150, 200, 250 and 300 m. Use the track and the boundary as guides.
- At each point run a speed test for 20 s. Note the band.
- Repeat each point with the phone in a pocket.
- Record RSSI and SNR with the Wi‑Fi scanner in the iOS Airport Utility app. Turn it on in Settings first.
- Mark the point where 5 GHz drops. Mark where 2.4 GHz drops below 10 Mbps.
What to look for
| Check | Pass mark |
|---|---|
| 2.4 GHz at 100 m | ≥50 Mbps |
| 2.4 GHz at 200 m | ≥20 Mbps |
| 5 GHz at 50 m | ≥30 Mbps |
| 5 GHz at 100 m | expect failure |
| RSSI at 100 m, 2.4 | ≥ −75 dBm |
| RSSI at 100 m, 5 | ≥ −80 dBm |
If 2.4 GHz fails at 100 m, the canopy is worse than the LiDAR model. If 5 GHz works at 100 m, the phone transmits better than 18 dBm. Both results change the design, not just the numbers.
One cheap test that answers the big question
Temporarily raise the AP by 8–10 m on a pole, or move it to the container roof, and repeat the 5 GHz walk. If the range jumps from 50 m to 120 m or more, the crown is the problem and a taller mast pays for itself. If it does not move, the phone's uplink is the limit and no mast height will fix it.
What is modelled, and what is not
The method
- Path loss comes from the atlas page's 780‑point RSSI grid (LIST LiDAR 2 m canopy, terrain, foliage, 3 dB clutter). I converted each point with PL = 40 − RSSI, which follows from the page's own 30 dBm AP, 8 dBi antenna and 2 dBi laptop.
- Downlink at the phone: 38 dBm − PL + 0 dBi − body loss.
- Uplink at the AP: 20 dBm (2.4) or 18 dBm (5) − body loss − PL + 8 dBi.
- Throughput is the smaller of the two directions, computed as bandwidth × 0.55 × log₂(1 + SNR), capped at 300 Mbps on 2.4 GHz and 700 Mbps on 5 GHz.
- Noise: −174 dBm/Hz plus the bandwidth plus 5 dB (phone) or 4 dB (AP).
- Body loss: 2 dB in the hand, 8 dB in a pocket.
The limits
- No measurement. This is a second model on the same terrain data. Treat the bands as 10–90% ranges, not as values.
- The iPhone transmit power is unpublished. 20/18 dBm EIRP is a central value. ±4 dB moves the 5 GHz edge between 30 m and 90 m.
- Rate adaptation is simplified. A real phone can drop to 20 MHz and stay associated past the modelled edge, at 10–20 Mbps.
- Trees grow. The canopy is the 2026 LIST LiDAR. A wet spring and new growth add loss.
- The grid stops at the boundary. Colour outside the yellow line in Figure 1 is extrapolation.
Coverage fractions count the 780 grid points. "Parcel" means those points, not every square metre.
Sources
- The Connection Atlas, Lot 1 Sheffield Rd, 24 Oct 2026: pages.petrieserver.com. Path‑loss grid, canopy model and the laptop figures.
- Whole‑parcel 15 m mast audit, 24 Oct 2026: pages.petrieserver.com. Site layout and backhaul options.
- iPhone 11 Wi‑Fi 6 specification (802.11ax HE80, 2TX, 1.2 Gbps): macotakara.jp.
- Australian LIPD class licence: legislation.gov.au. 36 dBm EIRP at 2.4 GHz and at 5.725–5.85 GHz: Powertec AU 5725–5850 MHz.
- Esri World Imagery: esri.com. Basemap for the plates.
One line, again
2.4 GHz carries the property. 5 GHz stops at about 50 m from the N105 mast. The uplink is the limit, and the 1 m under the crown makes it worse. Move the AP above the canopy, keep phones on 2.4 GHz, and add an AP at the container. Test before you sign.