At 15 m, the best cellular signal is not at the container
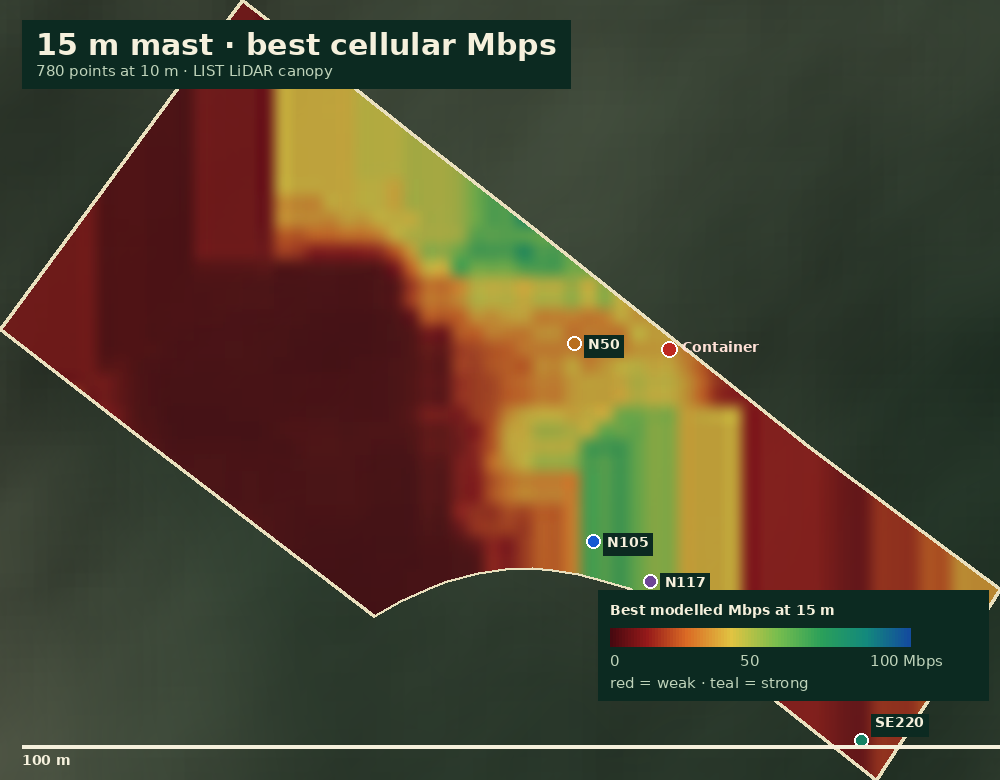
We scanned every 10 m point inside the parcel at a fixed 15 m mast and modelled Deloraine (124°) and Sassafras (63°) with the LIST LiDAR canopy. The hot band runs 50–230 m south and south-east of the container. The best tree spot, N105, is 105 m south.
Central link model · 700/900 MHz
LIST LiDAR 2 m canopy
N105
| Tree / mast | 22 m / 15 m |
| Distance | 105 m |
| Backhaul | 105 m fiber |
SE220
| Tree / mast | 23 m / 15 m |
| Distance | 221 m |
| Backhaul | 221 m fiber |
N50
| Tree / mast | 17 m / 15 m |
| Distance | 50 m |
| Backhaul | 50 m Cat6 PoE |
The trade-off in one sentence
The signal improves as you move south/south-east, away from the container, because the path shifts off the worst ridge canopy — but the cable to the container grows from 50 m to 221 m. N105 is the best signal-per-metre; SE220 is the strongest absolute signal; N50 is the no-fiber option.
Put the AP 1 m under the antenna — then click anywhere
The WAVLINK AP sits at 14 m, one metre below the 15 m antenna. Choose a candidate and band, then click any point inside the yellow parcel boundary. The app returns the nearest 10 m sample: distance from the AP, RSSI and predicted laptop download speed at 1.5 m above ground.
2.4 GHz 40 MHz · 5 GHz 80 MHz
780 points · click to query
Colour = predicted laptop speed. Red is weak, green strong, blue the fastest. The overlay is transparent outside the parcel. Click to query; the model is not a survey.
Every candidate, both bands, one visual language
These are the finished plates for the five AP-at-the-antenna scenarios. The 2.4 GHz plates use a 0–300 Mbps scale; the 5 GHz plates use 0–800 Mbps. The AP is blue, the container is red, and the rings are 100/200/300 m.
Same 14 m AP height
Same 1.5 m laptop
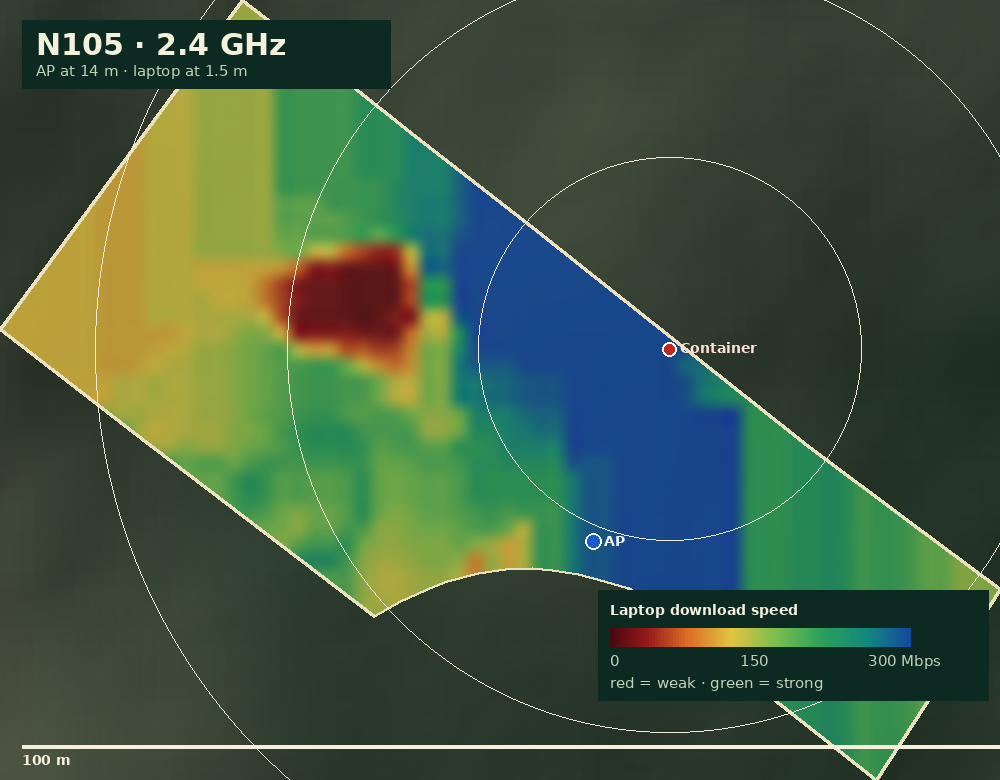
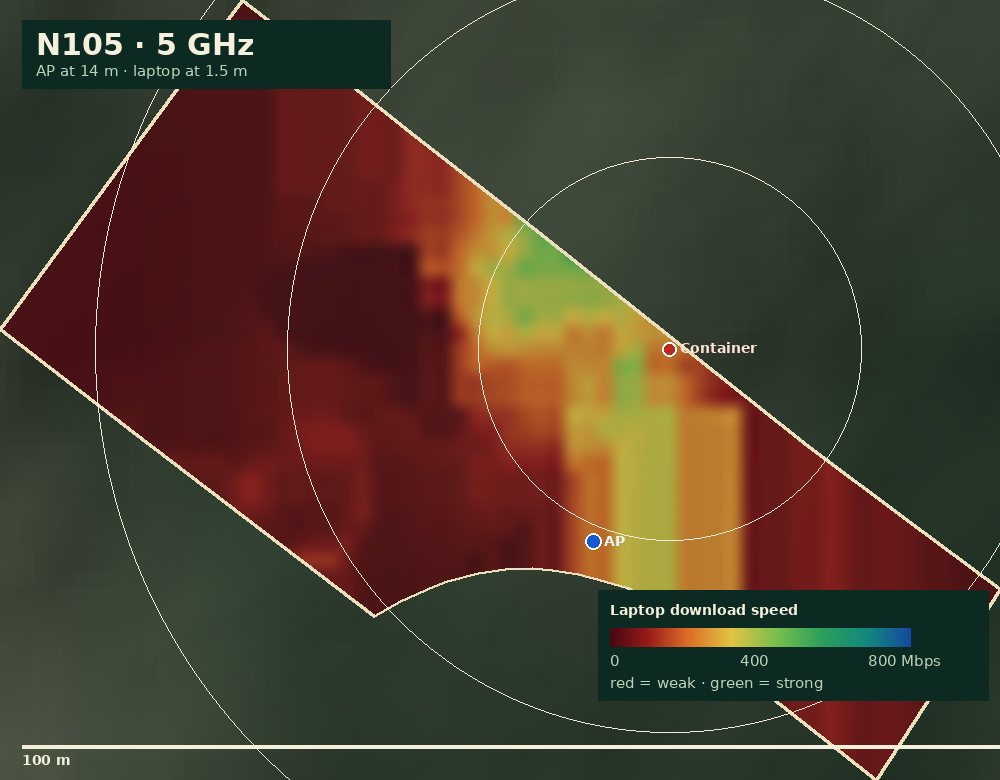
N105: 300 Mbps at container on 2.4 GHz · 346 Mbps on 5 GHz. The red band west of the AP is the terrain/forest shadow; the blue band through the container is the open path.
N105
Best single-AP compromise. 94 Mbps cellular; 300/346 Mbps at container. The AP is inside a 22 m tree crown.
N50
Best container WiFi. 300/672 Mbps at container, nearly full-parcel coverage. Cellular is weaker: 44/14 Mbps.
SE220
Strongest cellular (−67 dBm, 75 Mbps), but 5 GHz at the container is only ~100 Mbps.
N117 / NW288
N117 is close to N105; NW288 is the weakest for the container (5 GHz ~12.5 Mbps).
The AP at the antenna is not the same as WiFi at the container
The container is the critical client. The AP-at-antenna scenarios put the source 51–291 m away from it. The table is the predicted container link; the container-AP reference is a 3 m AP at the container, not at the antenna.
Inside the metal box: subtract 10–15 dB
2×2 laptop
| AP location | Container 2.4 GHz | Container 5 GHz | Parcel coverage 2.4 / 5 | 90% range 2.4 / 5 |
|---|---|---|---|---|
| N105 · 14 m AP Primary compromise |
-61.7 dBm 300 Mbps |
-73.3 dBm 346.3 Mbps |
100.0% / 93.2% | 276 / 278 m |
| SE220 · 14 m AP Strongest cellular |
-72.4 dBm 217.9 Mbps |
-85.7 dBm 100.3 Mbps |
50.0% / 34.9% | 465 / 227 m |
| N50 · 14 m AP Best container WiFi |
-50.1 dBm 300 Mbps |
-59.3 dBm 672.3 Mbps |
100.0% / 99.9% | 234 / 234 m |
| N117 · 14 m AP Close alternative |
-64.5 dBm 300 Mbps |
-76.9 dBm 266.8 Mbps |
85.8% / 54.2% | 318 / 311 m |
| NW288 · 14 m AP Long fiber / weakest container |
-81.1 dBm 121.1 Mbps |
-96.8 dBm 12.5 Mbps |
91.4% / 75.1% | 402 / 269 m |
| Container AP · 3 m Reference AP at container |
-28.1 dBm 300 Mbps |
-37.2 dBm 800 Mbps |
84.0% / 53.6% | 274 / 285 m |
N50 wins the container
51 m, 300 Mbps on 2.4 GHz and 672 Mbps on 5 GHz. If the AP must be at the antenna and container WiFi is the priority, N50 is the one. But its cellular link is the weakest of the three main spots (44 Mbps Optus / 14 Telstra).
SE220 and NW288 fail the container on 5 GHz
SE220 gives 100 Mbps at −85.7 dBm; NW288 gives 12.5 Mbps at −96.8 dBm. They are excellent cellular spots but poor WiFi sources for the container. N105 is the compromise: 300/346 Mbps at 98 m.
The WiFi range is a shape, not a circle
Range means the distance where a laptop still gets ≥10 Mbps. The bars show the 90th-percentile good distance. Terrain, canopy and the parcel shape make the real coverage irregular — use the app for the shape.
5 GHz = blue
Scale: 0–500 m
2.4 GHz — the reliable band
N50 and N105 cover essentially the whole parcel; N117 86%; SE220 50%; NW288 91%. Use 2.4 GHz for the camera, phones and the container link.
5 GHz — the fast local band
5 GHz gives 300–800 Mbps close to the AP, but at SE220 it falls to 100 Mbps at the container and 35% parcel coverage. N50 is the exception: 99.9% coverage.
One AP at the antenna: N105. Two APs: still better.
If you insist on a single AP, N105 at 14 m is the best compromise: the best cellular result (94 Mbps Optus / 42 Telstra) and strong container WiFi (300/346 Mbps). If container WiFi is the top priority, N50 is better (300/672 Mbps) but cellular drops to 44/14. For both, use two APs.
before the field test
The three honest choices
N105 at 14 m
94 Mbps cellular; 300 Mbps 2.4 / 346 Mbps 5 at the container; 100%/93% parcel coverage; 105 m fiber.
N50 at 14 m
300/672 Mbps at the container; 100%/99.9% coverage; 50 m Cat6 PoE; cellular only 44/14 Mbps.
SE220 at 14 m
75 Mbps at −67 dBm; 2.4 GHz 218 Mbps at the container; 5 GHz only 100 Mbps; 221 m fiber.
The best design
Two APs beat every single-AP compromise:
- Container AP at the container: 300 Mbps 2.4 / 800 Mbps 5; best client WiFi.
- Mast AP at 14 m only if you want WiFi around the mast; connect it by fiber or PoE.
- N105 mast remains the cellular best compromise; fiber 105 m.
- N50 is the easy no-fiber build, but weaker cellular.
Do not rely on 5 GHz at SE220/NW288
The container is 214–291 m away. At SE220 the 5 GHz link is ~100 Mbps at −85.7 dBm; at NW288 it is ~12.5 Mbps at −96.8 dBm. Choose those spots for cellular, not for container WiFi.
| Design | Container WiFi | Cellular | Verdict |
|---|---|---|---|
| Single AP at N105, 14 m | 2.4 GHz 300 · 5 GHz 346 Mbps | 94 / 42 Mbps | Best single-AP compromise |
| Single AP at N50, 14 m | 2.4 GHz 300 · 5 GHz 672 Mbps | 44 / 14 Mbps | Best container WiFi |
| Single AP at SE220, 14 m | 2.4 GHz 218 · 5 GHz 100 Mbps | 75 Mbps @ −67 dBm | Strongest cellular |
| Single AP at NW288, 14 m | 2.4 GHz 121 · 5 GHz 12.5 Mbps | 62.7 Mbps Optus | Avoid for container WiFi |
| Dual AP: N105 mast + container AP | 300 / 800 Mbps at container | 94 / 42 Mbps | Best overall |
What to do next
Test N105, N50 and SE220 at exactly 15 m with both carriers, band-locked to Telstra B28/n5 and Optus n8/n28. Test the WAVLINK AP at the container and at 14 m. If N105 gives ≥30 Mbps stable, build it with 105 m fiber and a local AP; if container WiFi matters more, compare N50. Do not sign a 24-month plan before the test.
What is modelled, and what is not
This is a desk study built on LIST LiDAR canopy, AWS terrain, published tower data and a central link model. It is designed to choose field-test points, not to replace a survey.
No on-site measurements
Model, not a guarantee
The model
- Cellular: 780 points at 10 m; 15 m mast; Deloraine 7304001 and Telstra Sassafras 7307001; dominant-edge diffraction + 9 dB multiple-edge allowance; P.833 foliage; LIST LiDAR canopy; Shannon throughput.
- WiFi: AP at 14 m (1 m under the antenna) or 3 m for the container reference; laptop at 1.5 m, 2×2, 2 dBi; AP 30 dBm, 8 dBi; 2.4 GHz 40 MHz, 5 GHz 80 MHz; terrain, canopy, foliage, 3 dB clutter; Shannon × MAC efficiency.
- Grid: 780 parcel points at 10 m; click returns the nearest sample.
- Scales: cellular 0–100 Mbps; WiFi 2.4 GHz 0–300 Mbps; WiFi 5 GHz 0–800 Mbps.
The limits
- No on-site measurements: tower power, tilt, cell load and canopy density can move RSSI by ±10 dB.
- LiDAR is a sample, not a 3D crown: the ray may pass between crowns or through dense stand.
- Outdoor WiFi: the container wall is not modelled; inside the metal box subtract roughly 10–15 dB and expect lower 5 GHz.
- Interference: 2.4 GHz is crowded; no spectrum survey was done.
- Tree safety/planning: arborist, native vegetation, bushfire, powerline and lightning are not assessed.
- Carrier plans: 5G Home products are supplied-modem, not BYO; confirm data-only SIM rules.
Sources
- Tasmanian LIST Tree Canopy Height (2 m LiDAR): LIST ArcGIS REST · thelist.tas.gov.au.
- ACCC Mobile Infrastructure Report 2026: data.gov.au · ACMA/RFNSA via GIS Geek: Telstra Deloraine.
- Reolink TrackMix: reolink.com · MikroTik ATL 5G R16: mikrotik.com · WAVLINK AX3000: wavlinkstore.com.
- Renogy 12 V 200 Ah LiFePO4: renogy.com · Victron MPPT: victronenergy.com.
- Telstra 5G Home: telstra.com.au · Optus 5G Home: optus.com.au · Starlink: starlink.com/au.
- NASA POWER: power.larc.nasa.gov · AWS Terrain Tiles: Registry of Open Data · Esri World Imagery: esri.com.
Bottom line
N105 at 14 m is the best single-AP-at-the-antenna compromise: 94 Mbps cellular, 300 Mbps 2.4 GHz / 346 Mbps 5 GHz at the container. N50 gives the best container WiFi (300/672 Mbps) but weaker cellular. SE220 is the strongest cellular (−67 dBm) but its 5 GHz container link is ~100 Mbps. Two APs — one at the container, one at the mast — is still the best design. Test before committing.